

The millions of transactions across 18+ blockchains entails a big need for data visibility and analysis on the Synapse Network.
Introducing the Synapse Explorer: an easy-to-use event indexer for all Synapse Bridge events. Synapse-based transactions can now be viewed by chain, token, address, and more, and are also accessible via graphQL endpoint so that anyone can now run analytics as they wish.
In this post, we’ll be providing a walkthrough of how to navigate the explorer so that users can get the most out of it.
Let’s dive in!
Main Page
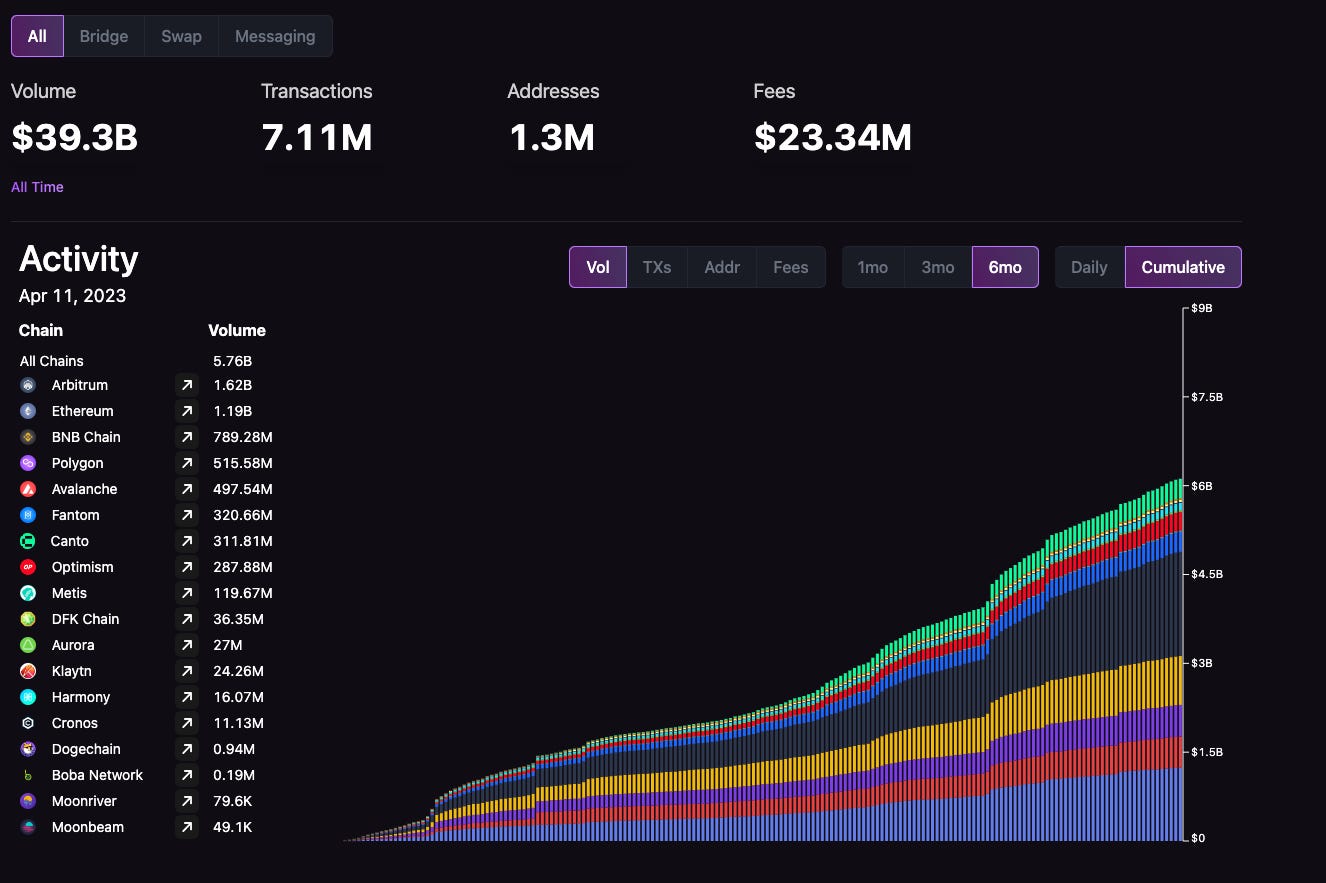
The main page by default displays cumulative data for the following:
Bridges, swaps, and messaging, although this can be switched to show any of the three individually.
Transaction volume (in USD), although this can be switched to transaction count (“TXs”), number of unique addresses (“Addr”), or total fees generated (“Fees”).
The prior 6 months; the past 1 month or 3 months are also possible.
Cumulative data, although this can be switched to daily.
The default view shows the incredible pace that the Synapse Bridge has been growing over the past 6 months, with total transaction volume surpassing $39B. This is especially significant in light of current market conditions and a testament to the quality of the product
Referencing the left column, it’s possible to see data based on each individual blockchain that Synapse supports. You can learn more about each one by clicking on the arrow beside their names - we’ll use Arbitrum as an example in the next section.
If you scroll down to the bottom of the main page, you can click “Explore All Transactions” which then gives a comprehensive overview of all confirmed and pending transactions.
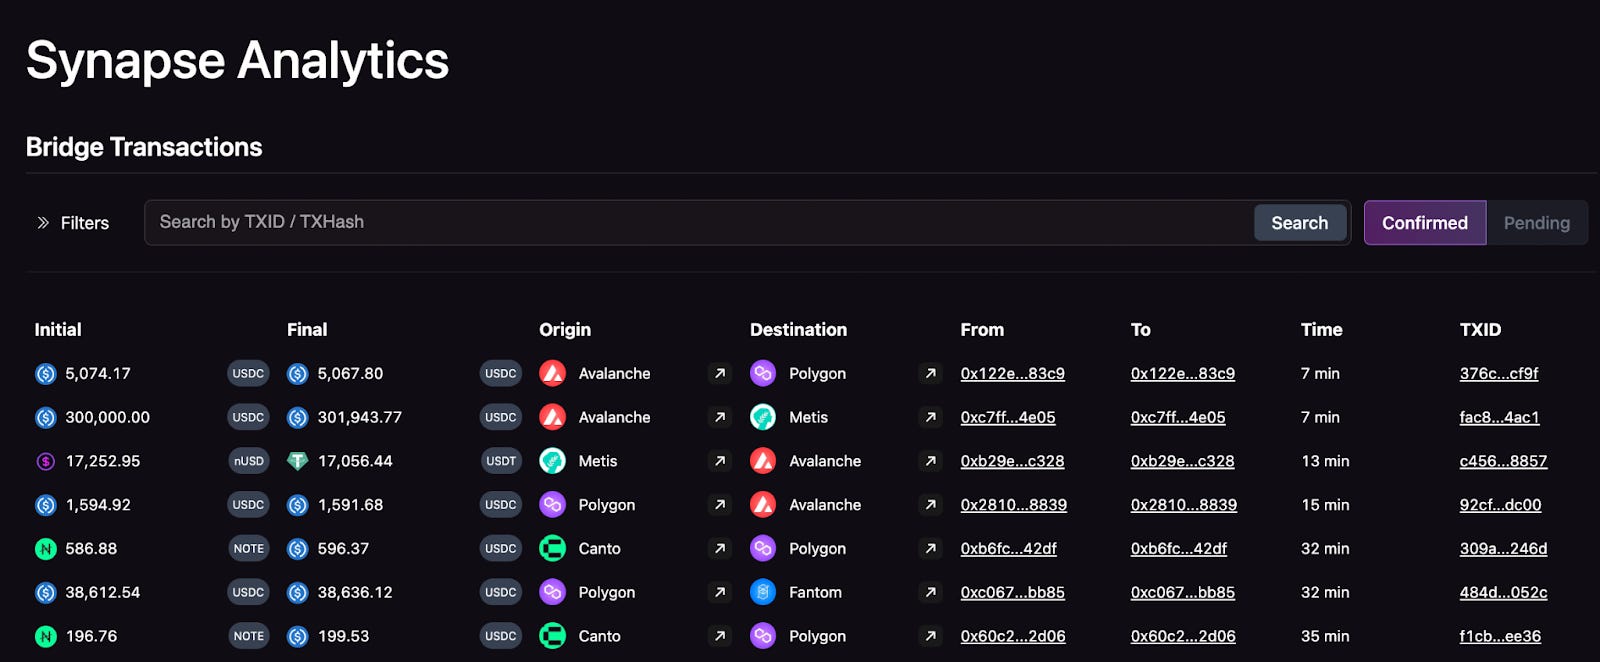
The pending transactions can be useful for diagnosing network issues. One real-world use case might be a Synapse Explorer user that decides to categorize pending transactions by type in order to diagnose the problem and propose a solution. For example, Synapse’s support often helps out users seeking their pending transaction by finding it on the Explorer and sending the relevant transaction data to them.
Clicking on any individual user’s address or any transaction ID (“TXID”) will take you to their respective pages, where you can then filter by transactions as desired.
Now - let’s check out Arbitrum! As a reminder, this can be found by clicking on the arrow beside their name at the top of the main page.
Arbitrum - Transaction Data
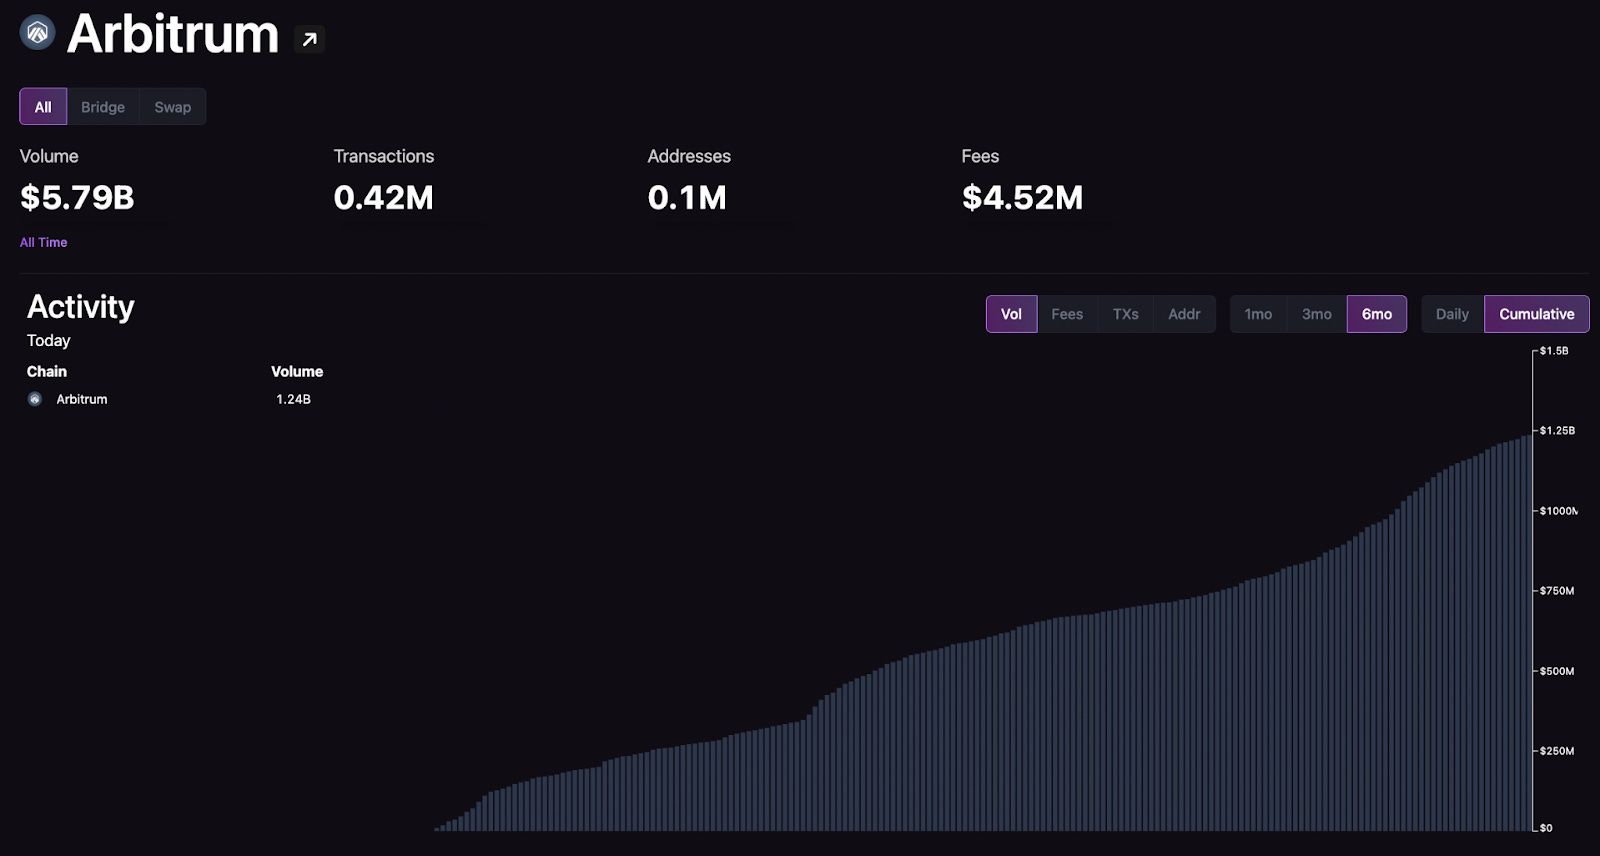
Each blockchain-specific page shows the default data as the main page, and once again may be changed based on one’s desired data view.
By scrolling down, we can see:
Transactions sent from Arbitrum (“Outgoing”).
Transactions arriving to Arbitrum (“Incoming”).
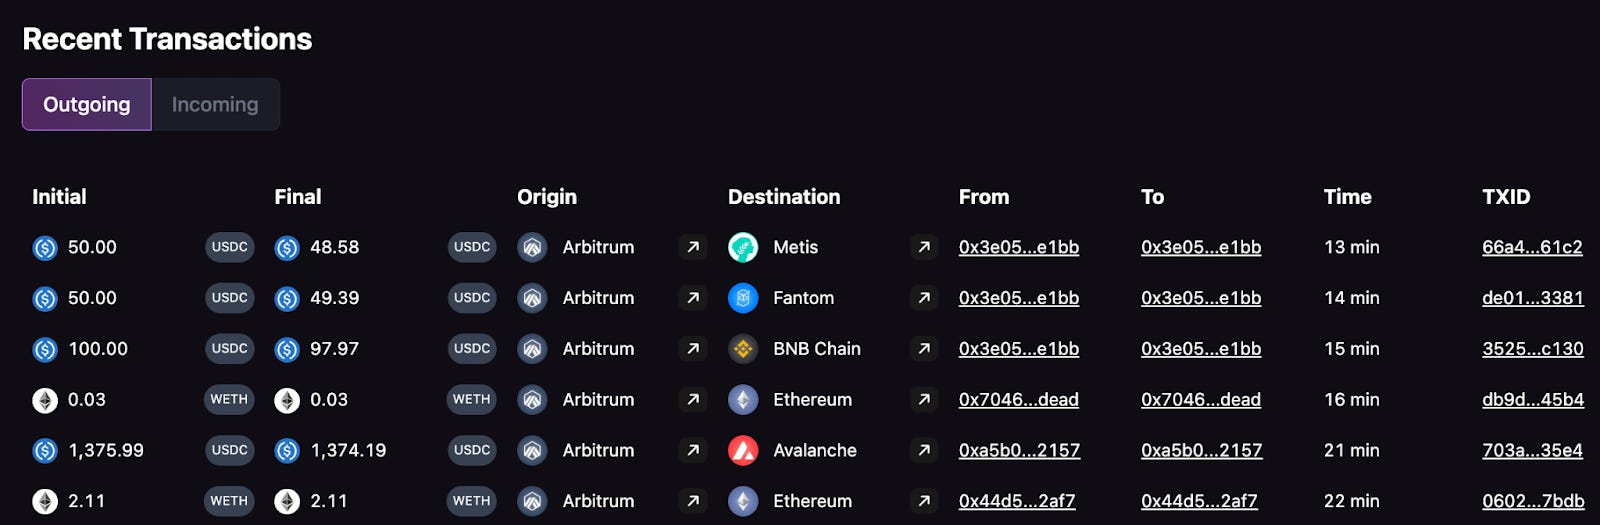
Clicking on a given token’s icon under the “Initial” column will take you to the token’s page that corresponds to the Origin blockchain network. Whereas the token icon under the “Final” column will take you to the token’s destination blockchain network.
For example, clicking on the $USDC’s icon in Row 1 would take one either to USDC Arbitrum or USDC Metis, depending on which of the two columns is clicked. Let’s click on the “Final” column’s USDC.
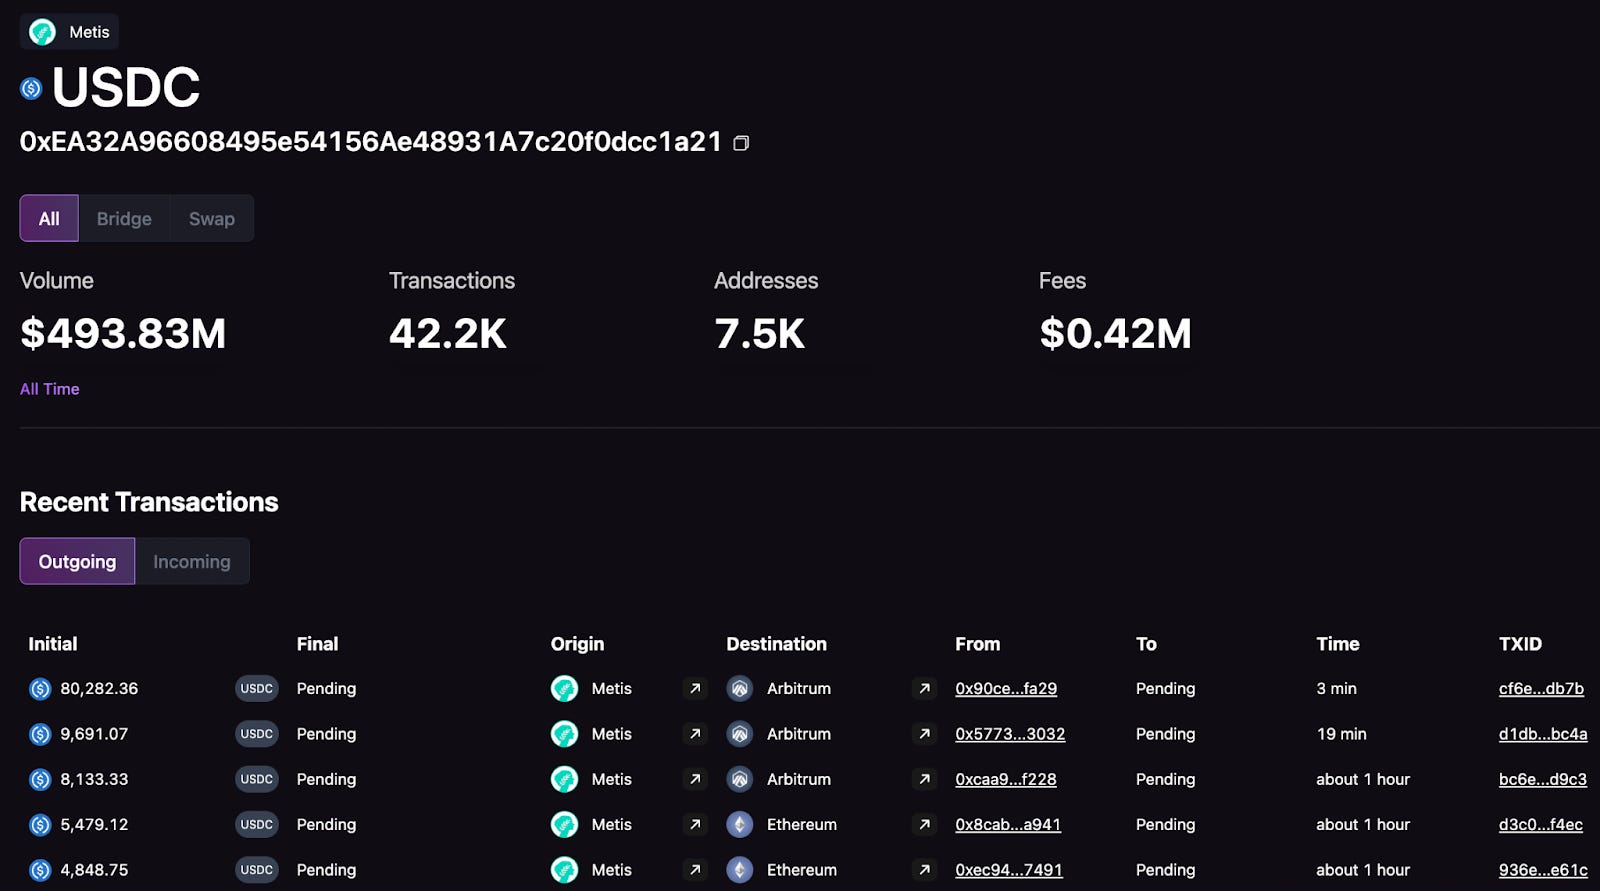
Now, on the Metis USDC page you can see all applicable transactions that have occurred. The default here is data for both bridge transactions and swaps alike, but this can be changed by going from “All” to either “Bridge” or “Swap”.
Getting the Most Out of Synapse Explorer
It should now be clear that users can use the Synapse Explorer for a myriad of use cases and data dives, leading to the most cross-chain transparency experience to date.
Why might this be relevant?
As DeFi adoption grows and blockchain interoperability becomes even more important than ever, Synapse will remain a top solution. Having this explorer setup as a foundation will enable users of Synapse to view data as they please, monitor the Synapse Network, and run analytics upon an API in order to unlock new insights.
Have any features that you’d like to see? If so, make sure to drop a comment below.
In the meantime, you can follow along via the following: